On this page
- Report Card
- Scoring Summary
- Qualified Score
- Qualified Score Confidence
- Overall Reviewer Opinion
- Accuracy
- Failed Assessments
- Qualified Score Factors
- Subscore Analysis
- Subscores Expected Ranges
- Assessments
- Solutions
- Reviewer Score Cards
- Opinions & Feedback
- Portfolio
- Solutions Summary
- Solution Details
- Insights
- Submission Code
- Performance
Interpreting Structured Evidence
While reviewers (who are typically engineers) on your team will want to utilize Qualified's review dialog to inspect solutions in great detail, hiring managers are more likely to want to understand a candidate's performance at a higher level. As part of Qualified's Evidence Engine feature-set, you can do exactly this with the "Evidence" dialog. We will be covering this dialog in this article.
Beta Feature
The features mentioned in this article are in beta and may not be enabled on your account. Please reach out if you are interested.
Report Card
The most common view of the evidence dialog is the "Report Card". This view captures all of the information about evidence collected so far. This is the view shown by default and is access either by clicking "Report Card" from the candidate details screen, or by clicking the "Qualified Score".
The report card view is able to show you how well a candidate performed on a single assessment, or on all assessments submitted so far. It is printable, and configurable, allowing you to customize exactly how you want to present data to others.
Let's walk through each section of the report card to build a better understanding of its purpose and value...
Scoring Summary
The scoring summary helps you understand all of the key scoring information about the candidate. As a candidate progresses through your evaluation process, possibly taking multiple assessments – this view will help you understand the candidate at an aggregated level.
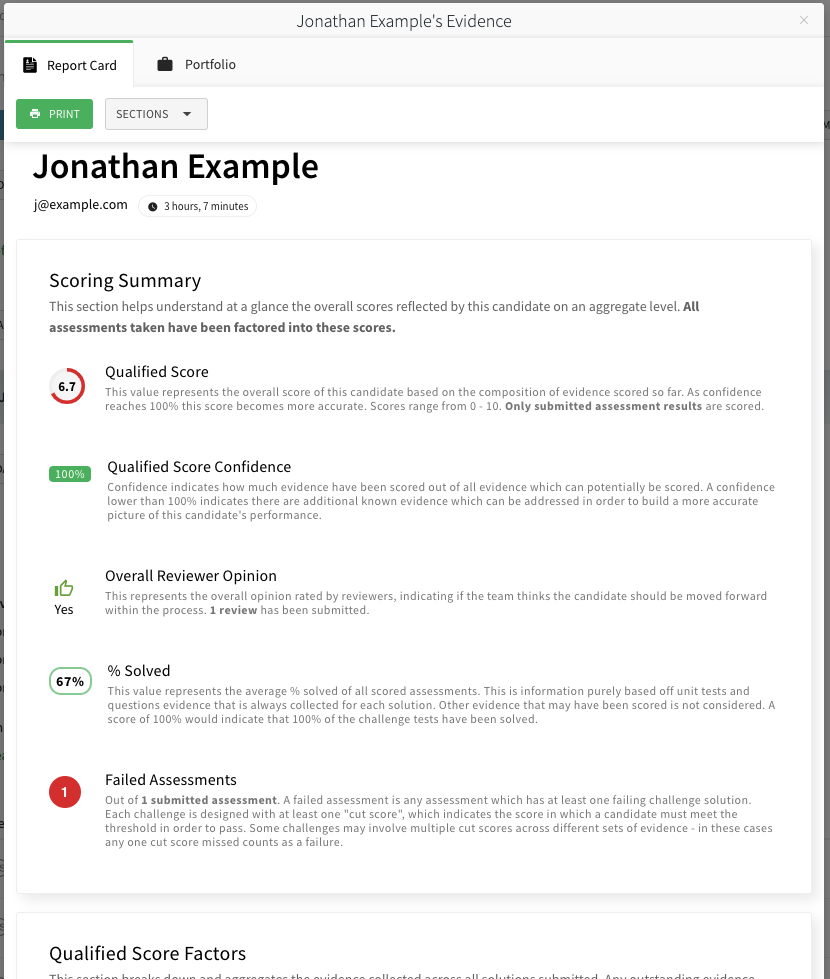
Qualified Score
The Qualified Score is a score which is calculated by the system, based on the assessment result submitted and the evidence mappings configured for each challenge. Challenges factor into the score based on which signals are scored and how they are weighted. You can find more detailed information in the scoring concepts article.
Important
It is important to understand that this score only takes into account known data. For example, if an assessment has outstanding scorecards which have not yet been rated by your team, then this score will NOT factor those signals in. Only once the scorecards have been submitted will the score take those signals into account.
Qualified Score Confidence
Since the Qualified Score does not factor in signals which are expected to be collected, but have not have been collected yet, there needs to be a way of understanding how "complete" the Qualified Score is. There is where confidence comes in. As more signals are completed, the confidence will increase, eventually hitting 100%.
Getting to a 100% confidence score isn't always necessary. You can disqualify candidates in stages. If a candidate submits an assessment with a low score, confidence will be low since they have not been reviewed yet – but improving confidence may not be necessary. You can disqualify candidates who performed poorly, saving you time and allowing your team to spend their time on the candidates which show promise.
Tip
Disqualify low-performing candidates without needing to review them. Utilize the confidence score on the remaining candidates to determine which candidates still could use further review in order to better understand their strengths and weaknesses.
Overall Reviewer Opinion
Reviewers perform two main actions when reviewing assessments:
- They rate scorecards to better understand on an objective level the specific subject areas that a candidate may be strong or weak in.
- They provide their own subjective opinion as to whether or not they would move forward with the candidate in the process.
The overall review opinion score is where the subjective opinions enter the picture. As each member on your team gives their opinion (on a "Strong No" to "Strong Yes" scale), those opinions will be averaged together into one overall opinion. All opinions, from all reviewed assessments, which be aggregated. The overall review opinion score is where the subjective opinions enter the picture. As each member on your team gives their opinion (on a "Strong No" to "Strong Yes" scale), those opinions will be averaged together into one overall opinion. All opinions, from all reviewed assessments, will be aggregated.
Tip
Utilize overall opinion to determine if you should either move candidates forward in the process, or disqualify them.
Accuracy
This is the overall averaged % score of all assessments submitted. This can be useful for getting a raw sense of how well a candidate performed on their assessments, without assessment weighting or reviewer scorecards being factored in.
Evidence Engine settings are not considered
Nothing configured within the Evidence Engine configuration will have any impact on this score. Accuracy only takes passed unit tests into account for coding challenges, and correct answers for Q&A challenges.
The Accuracy score is simply the average of all submitted assessment results, which are in turn an average of all solutions within the assessment. If one assessment has more solutions than another, then technically each solution will count less towards the score since that solution will make up less of the assessment result's Accuracy score.
Example:
There are two submitted assessment results. One scored a 50% and has 3 solutions, the other 100% and has 2 solutions; The overall accuracy score will be (50 + 100)/200) = 75%). Solution count is not factored directly into the overall score, but solution count is factored into each assessment result score.
Failed Assessments
Each challenge on an assessment can have one or more cut scores set, which is defined within the challenge's Evidence Engine configuration. Cut scores are passing thresholds, if a score is below that threshold, then the solution for a challenge is considered to be failed. If any solutions on an assessment result fail, the assessment is considered failed.
Failed assessments are shown for informational purposes. If a candidate fails an assessment, you likely will want to reject the candidate – though the candidate will need to be manually rejected by your team.
Note
Currently the automated workflow engine does not incorporate information about failed assessments, as defined through the Evidence Engine. This is due to Evidence Engine being a newer feature. In the near future it will be possible to incorporate failed assessments into your automated workflows.
Tip
You can quickly identify a candidate who failed. Any candidate with a red "Qualified Score" ring indicates that at least one failed assessment exists.
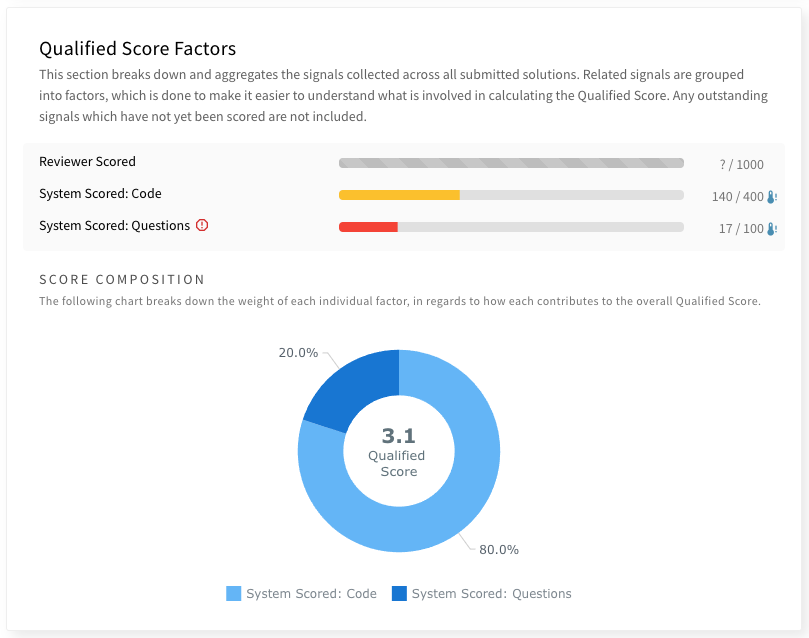
Qualified Score Factors
Since the Qualified Score is a composite of different signals, grouped and weighted, the report card will break down the score into the different factors that is is composed of. The three factors (signal groupings) that will always be identified are:
System Scored: CodeSystem Scored: QuestionsReviewer Scored
Note
As more types of signals are supported in the system, this list will expand.
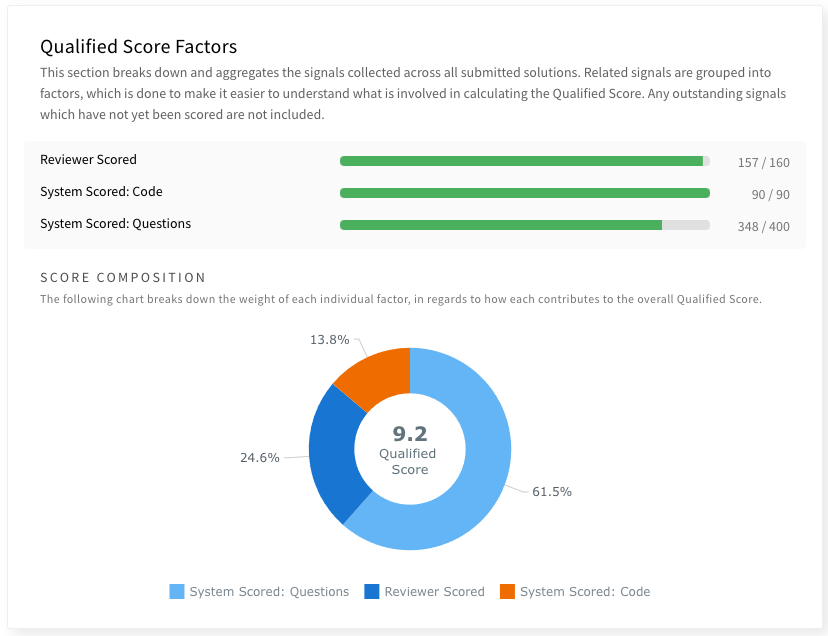
The score factors (aka signal grouping) that are present depend on which solutions have been submitted by the candidate. Un-submitted solutions are not factored in. However un-submitted reviewer scorecard ratings will be shown for any submitted assessment as a gray bar, to help indicate that there is more signal data to be harvested from an assessment result.
A chart is shown which breaks down the composition. Missing reviewer scorecard signals will not be included in the chart. The score shown in the middle of the chart is the Qualified Score.
Subscore Analysis
Subscores are a way for a challenge to showcase a candidate's potential within specific subject areas that each challenge is designed to target. Subscores are not factored directly into the Qualified score. Instead, subscores are ways to take signal data learned from a candidate's result and map one or more of the signals towards a subject. Each challenge within the Qualified library is already mapped to one or more subscores. Subscores are weighted and aggregated with all submitted solutions that target the same subscore subject.
By default, taking a coding challenge in a specific language will result in aspects of that challenge (typically the accuracy score) being scored towards that language's subscore. Other common subscores including those related to software quality, such as "Code Maintainability" and "Code Performance".
The subscore analysis presents all subscores calculated for the given "report "card scope (either all submitted assessment results, or a specific one). This view is your gateway into understanding what areas a candidate may not have performed well.
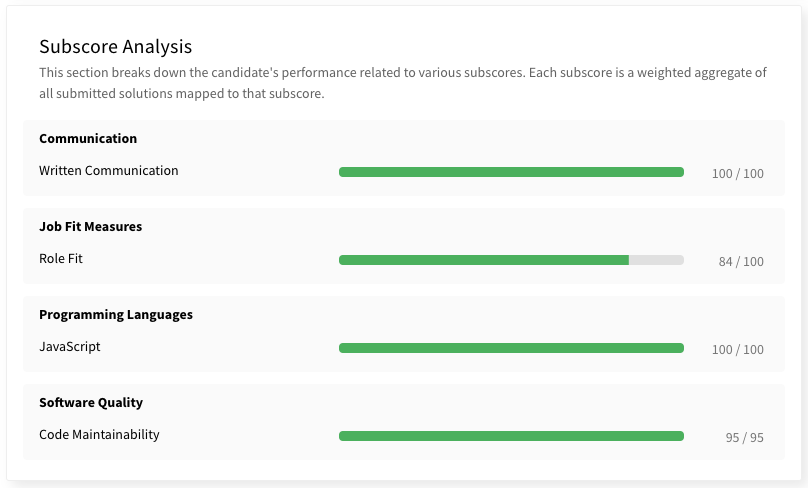
Subscores use the same values as Qualified score, with a score from 0 - 10.
Tip
Use Subscores to determine strengths and weaknesses that a candidate may have. Bring the report card to interviews so that you can discuss any red flags with candidates, and ask follow-up questions based on their subscores to help determine if any weaknesses are a major concern.
Subscores Expected Ranges
A subscore is a reflection of the overall difficulty of the content you have chosen to be assessed. It is not a normative range related to the candidate's overall ability for that subject area. If you only assign a single easy challenge for a given subscore, then that subscore may always end up being scored highly/perfectly by your candidates. Keep this in mind when designing your challenges and assessments.
Typically, you will use subscores to identify where a candidate may be under-performing, with an expectation that they will achieve a perfect score. This is due to most content on qualified being work sample based. You expect candidates to be able to do the work. For this reason many subscores will often times be a perfect 10 or close to it.
For Q&A challenges you may expect subscores to be more variable, as a more normative performance curve is to be expected. The variability of the score depends on how the Q&A challenges are designed.
Subscores that are related to reviewer scorecards may often be variable, regardless of the type of challenge being used. This is due to the qualitative nature of what most scorecards try to score. You should expect candidates to be able to complete most or all of the coding challenges in an assessment. However, that doesn't mean they will all complete the assignment with good quality code.
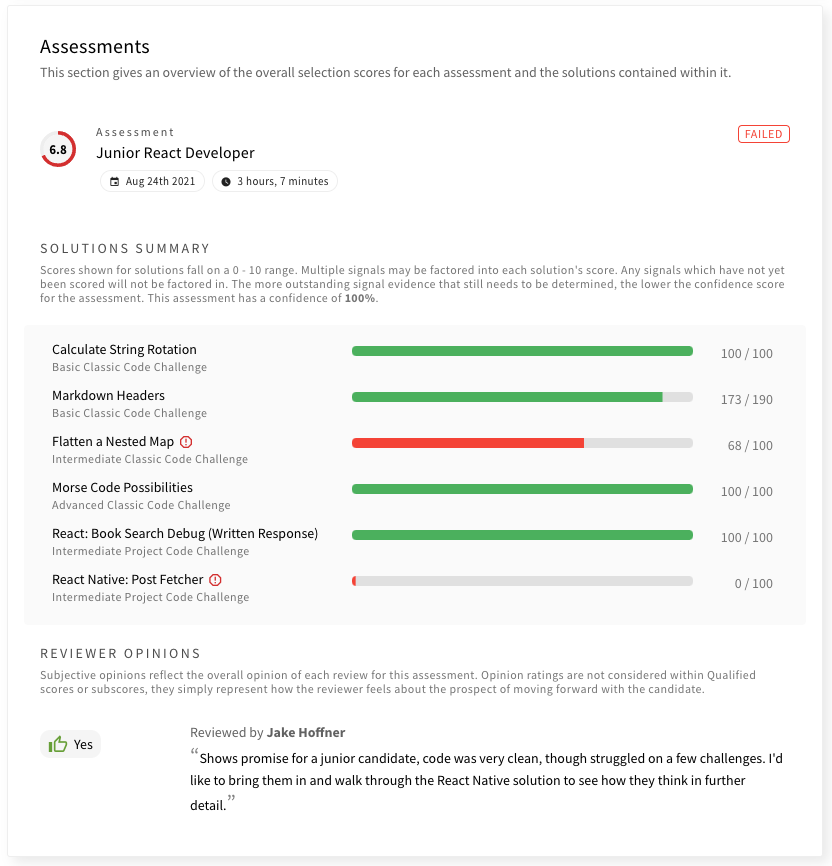
Assessments
The assessments section gives you an overview of how well the candidate performed on each assessment. From this view you can see key information, such as the Qualified Score for the result, whether the candidate failed, active time spent, and date submitted. You can also see the known evidence engine score for each solution and if that solution failed to meet minimum cut score thresholds.
If any reviewers on your team left an overall review, you will see their opinion and feedback here. Solution specific review feedback is saved for the Solutions section.
Note
All assessment results will show up in this section, but unsubmitted results will not be calculated or considered for scoring.
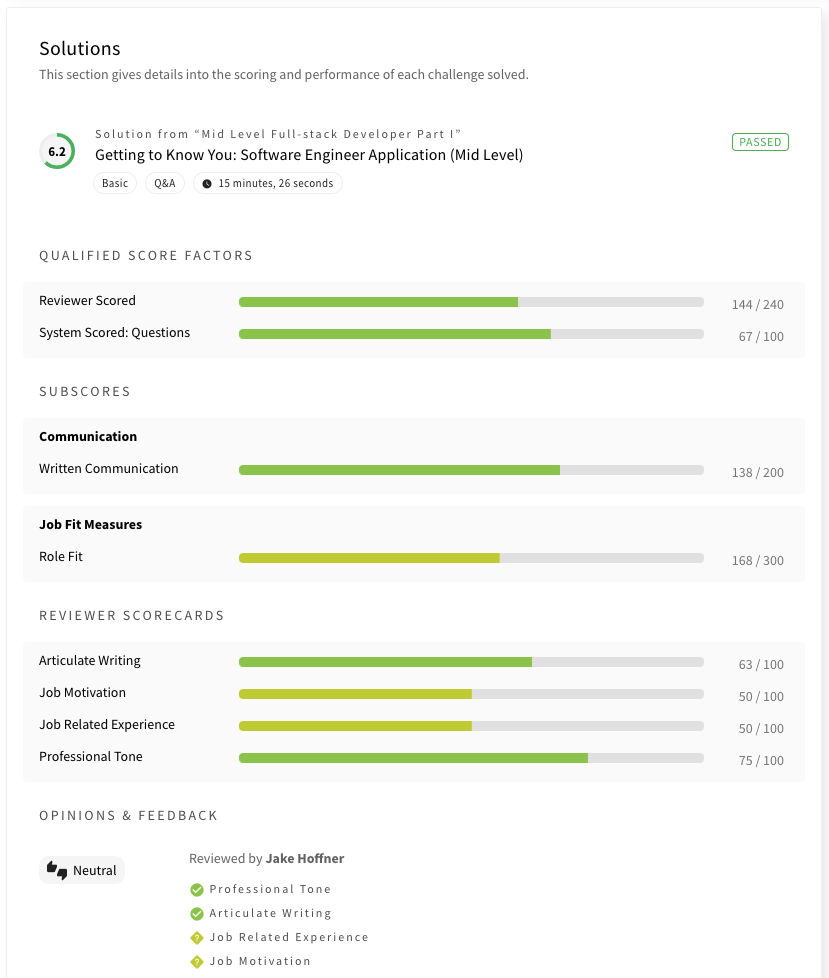
Solutions
Each solution is presented with detailed scoring information. By default, the following sections will be shown:
- Qualified Score Factors
- Subscores
- Reviewer Score Cards
- Opinions & Feedback
In addition to these default sections, the following sections can be enabled from the "Sections" dropdown:
- Challenge Purpose & Goals
- Stats & Cohort Performance
- Solution Insights
- Solution Failures
These sections are hidden by default on the Report Card tab, but are enabled on the portfolio tab.
Reviewer Score Cards
This area displays the aggregate score of each score card configured for the challenge. All reviewers' ratings are averaged without any weighting between reviewers.
Opinions & Feedback
This area displays each reviewer's opinion, and their specific score card ratings. If any feedback was provided, that will also be shown.
Tip
If you plan on giving your candidates feedback on their assessment performance, you can have your reviewers utilize the feedback section to provide details and motivation for their ratings. You can print the report card or save as a PDF (via print) so that it can be emailed.
Portfolio
The portfolio tab is similar to the Report Card, but is optimized for quickly reviewing all submitted solutions in more detail, including statistics about performance, and any failed test cases or questions.
We call this the portfolio because that's how Qualified views assessments. They aren't just tests, they are a collection of work, in most cases full work samples. As candidates take assessments in the Qualified platform, they continue to add to their body of work that can be analyzed and understood at a deeper level.
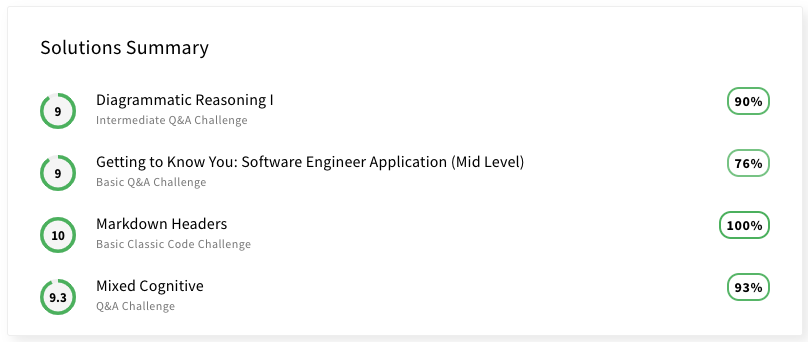
Solutions Summary
The solutions summary gives you a quick overview of all solutions, their Qualified Score, and their accuracy score. You can click on a solution to quickly navigate to that solution's details.
Solution Details
Insights
The system's AI will sometimes detect various data points which can be turned into insights. These insights cover a various topics. For example they might inform you that a challenge isn't passable, that a solution might warrant further playback review, that the candidate performed outside of typical ranges, etc.
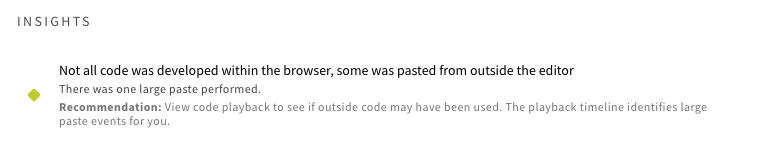
Insights are dynamic
Insights are refreshed as more data is collected. For example, a candidate might have initially performed within a normal range, but as more data it might be determined that their performance is actually an outlier.
Submission Code
When viewing solutions for a code based challenge, you can view the final state of the candidate's submitted code. There is a "Code Diff" toggle within the action bar. If you select that, you can view the difference between the starting state of the code, and the final state.
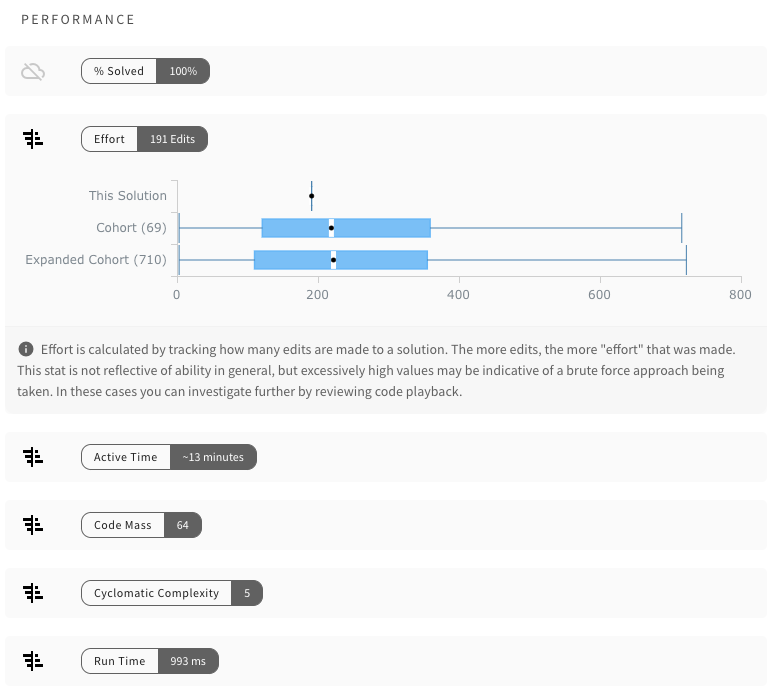
Performance
The performance section provides the values of each performance metric. If there is enough data to show, an expandable chart can be shown by clicking on the metric. This chart will show you where the solution fits into the cohort of your team's own candidates, as well as an expanded cohort of all candidates, if available.